CBRE has released its National Green Building Adoption Index 2014 which ranks green competitive commercial building adoption by US cities through the end of 2013. Authored by Rogier Holtermans and Nils Kok, the study is at once holistic in that it accounts for both Energy Star and LEED Certified buildings based as a percentage of the overall “stock of space, measured by both the number of buildings and the total square footage of the market”. But it is also very narrowly focused on CBRE’s area of expertise as it only focuses on competitive commercial properties, so no government buildings, single-tenant owner-occupied buildings, or healthcare projects are factored in to the certified properties or the stock space. No LEED for Commercial Interiors is included, only whole building certifications. They cleverly use a two year window for Energy Star and a five year window for LEED projects, thereby eliminating expired certifications. However, this eliminates older LEED projects as only LEED-EB projects need to be recertified at this time. Cities that were early adopters will be hurt by this criteria. Cities with a lot of LEED-EB projects are helped. For this study, 19.4% of the eligible commercial office space was LEED certified in the top 30 markets, with LEED-EB certification being the top certification at 79.4% of floor area, LEED Core & Shell being 14.4% and LEED-New Construction being 6.7%.
CBRE will publish this data on an annual basis, but provides some national data going back to 2005. All data is based on the largest 30 office markets.
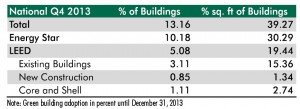
- Energy Star projects went from 1.3% of stock in 2005 to 10.2% of projects and 30.3% of square footage at the end of 2013.
- LEED projects had only 0.1% of commercial office space in 2005 and 5.1% by number and 19.4% by square footage at the end of 2013.
- The national charts shown are based on cumulative percentages.
So while the rapid market uptake is exciting, there is the disturbing plateau on both LEED and Energy Star projects. We’re far enough distanced from the recession that this plateau suggests that green building may have reached its market saturation. While it seems like a market failure that only 13.16% of commercial buildings are green, this 13.16% represents the current highest-performing buildings. LEED has always aimed for the top 25% of projects and regularly increases its stringency to maintain that level of rigor. Don’t expect its percentage of adoption to rise much more. But should this be troubling? Recall this is a very narrow scope and only includes the last five years of projects. This is a market saturation of the cutting edge. This cutting edge is raising the entire market via technology advancements, increased code requirements and proving that higher levels of efficiency are not only possible, not profitable.
Houston ranks fourth overall in the Index, behind Minneapolis/St Paul, San Francisco and Chicago. There are several criteria aggregated for the overall index so let’s look at how Houston fares in each criteria:
Overall: Fourth
Percentage of Total Green Buildings:
| 1 | Minneapolis/St. Paul | 29.7 |
| 2 | Atlanta | 26.6 |
| 3 | Manhattan | 24.4 |
| 4 | Houston | 22.2 |
| 5 | Los Angeles | 20.8 |
| 6 | Chicago | 20.0 |
Percentage of square feet of Total Green Buildings:
| 1 | Minneapolis/St. Paul | 77.0 |
| 2 | San Francisco | 67.2 |
| 3 | Chicago | 62.1 |
| 4 | Houston | 54.8 |
| 5 | Atlanta | 54.1 |
| 6 | Los Angeles | 49.7 |
Percentage of Energy Star Buildings:
| 1 | Minneapolis/St. Paul | 22.9 |
| 2 | Atlanta | 22.1 |
| 3 | Manhattan | 19.8 |
| 4 | Houston | 18.3 |
| 5 | Los Angeles | 17.3 |
| 6 | Chicago | 16.9 |
Percentage of Square Feet of Energy Star Buildings:
| 1 | Minneapolis/St. Paul | 62.8 |
| 2 | San Francisco | 52.3 |
| 3 | Chicago | 50.9 |
| 4 | Houston | 45.0 |
| 5 | Atlanta | 42.5 |
| 6 | Denver | 40.6 |
Percentage of LEED Buildings:
| 1 | Minneapolis/St. Paul | 12.1 |
| 2 | Manhattan | 9.7 |
| 3 | Atlanta | 9.0 |
| 4 | Houston | 8.9 |
| 5 | San Francisco | 7.6 |
| 6 | Chicago | 7.5 |
Percentage of Square Feet of LEED Buildings:
| 1 | Minneapolis/St. Paul | 39.4 |
| 2 | San Francisco | 39.2 |
| 3 | Houston | 32.1 |
| 4 | Chicago | 31.8 |
| 5 | Seattle | 31.8 |
| 6 | Denver | 27.5 |
You can find the complete report here:
http://www.cbre.com/o/international/AssetLibrary/Green-Building-Adoption-Index-2014_Final.pdf

